Wednesday, August 08, 2007
Graphs of the day
That sky blue piece of the pie (best to click for larger images) is the tax take for a typical one-income family in 1970 (top) versus a typical two-income family in 2000 (bottom). Graphs from Todd Zywicki, who notes,
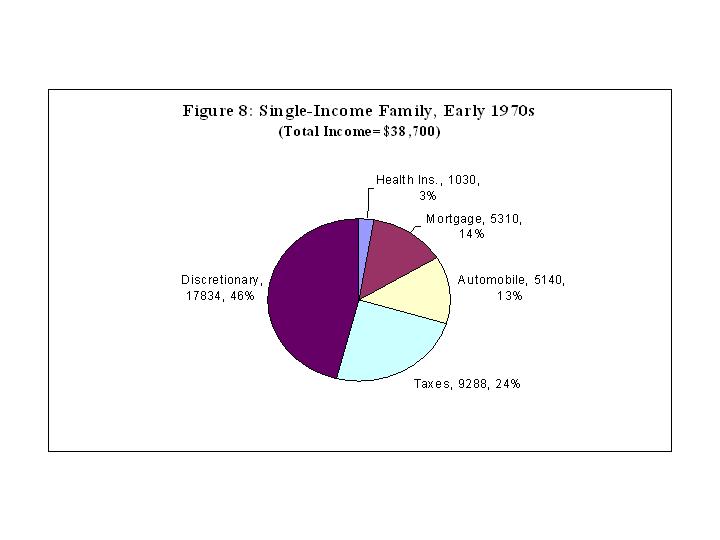
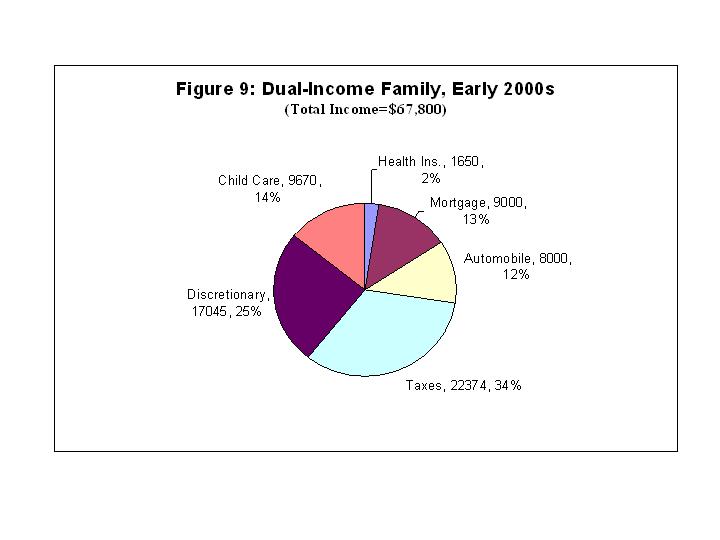
As can readily be seen, expenses for health insurance, mortgage, and automobile, have actually declined as a percentage of the household budget. Child care is a new expense. But even this new expenditure is about a quarter less than the increase in taxes. Moreover, unlike new taxes and the child care expenses incurred to pay them, increases in the cost of housing and automobiles are offset by increases in the value of real and personal property as household assets that are acquired in exchange."Oh no! They aren't talking about the marriage penalty again, are they?"
Overall, the typical family in the 2000s pays substantially more in taxes than in their mortgage, automobile expenses, and health insurance costs combined. And the growth in the tax obligation between the two periods is substantially greater the growth in mortgage, automobile expenses, and health insurance costs combined.
...the obvious problem for this "typical" American family appears to be an extremely high tax burden caused primarily by the progressive nature of the income tax that hits families with two working adults by kicking them into higher marginal tax rates.


