Friday, October 24, 2008
Graph of the day: The Obama discount?
 James Pethokoukis:
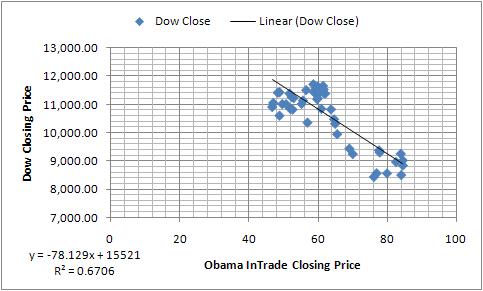
I find it hard to believe that fears about a deep recession are suddenly dawning upon investors and thus are solely responsible for kneecapping the market. I've been hearing such dire forecasts for weeks from top Wall Street economists, and I really think they're already baked into the cake. (And credit markets actually look like they are finally picking up a bit�a plus for stocks.) So with that perception locked in, maybe the future political landscape is finally playing a greater role in the minds of investors, especially with polls showing a possible landslide Obama win and big Democratic congressional majorities. Is it really more plausible to suggest no effect whatsoever from a possible once-a-generation, political sea change, especially one that moves away from the winning economic formula of the past 25 years? Not even a smidgen of worry? C'mon, now. (Emphasis in original.)The graph above has Dow Jones closing prices versus the price of the Obama contract on InTrade for the last fifty Dow trading days. (You can stop reading now, Ed, there's nothing useful in InTrade, you've said.) Dow data here, InTrade data here. The best fit line I've drawn, using Excel, is the equation in the lower left hand corner. It says every 1 point increase in the Obama contract (equal to 1% more likely he wins) decreases the Dow more than 78 points. The fit is pretty tight, but there are a couple of reasons for concern. First, the Obama contract trades on weekends unlike the Dow, and there is (by my casual inspection) a lot of trading on weekends, particularly Saturdays. So when I try to see which way causality flows I have an econometric problem that's difficult to correct (and I'll let the more savvy time series folks play with that.) If you just assume away the weekends, as I did above, it's more likely that the Dow leads the Obama contract than vice versa*. Falling Dow is a leading indicator of a sour economy, the sour economy favors the party out of (executive) power.
*Uses Granger Causality test, two lags, for those who want the econometrics. EViews file available.
Labels: economics


