Wednesday, April 23, 2008
It happens every spring
Two nights ago Mrs. S started shouting to me down the stairs (where I was in NBA playoff bliss) "we need to buy more gasoline." I realized she meant to bank more gasoline. We keep an account at First Fuel, where we have approximately $1500 socked away, purchased at $2.699. The newspaper blared yesterday morning that we had struck a record. Mrs. S, I've concluded, is a momentum investor.
Humor aside, it's worth wondering what is going on right now. We know that records should be corrected for inflation and for changes in taxes, but that won't explain everything. The recent state tax increase should have added only $0.02 so far, and Federal taxes haven't changed. The tax proposals of some (including John McCain) to have a Federal tax holiday doesn't help that much, as Menzie Chinn points out. Half of that shifts back towards oil companies. I'm not looking to tax windfall profits, but there's little sense boosting their profits further at this time. And Chinn notes "to the extent the lower price spurs gasoline consumption, this should increase the petroleum and petroleum products component of U.S. imports, and thence putting further upward pressure on the price of oil..."
Another issue is that these reports come out every spring. Last year we were talking about gas boycotts around this time. Two years ago it was ethanol, another pitch of the tax holiday etc. Three years ago it was evidence of stagflation. Like first pitch, it happens every spring. Here's a chart to show what I mean:
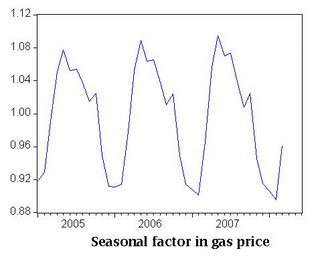 The technical term for this graph is that it is the Census X-12 seasonal factor for the price of a gallon of regular unleaded gas (all formulations, source.) If it matters to you, I estimated it with EViews 5.0 and estimated it over 1980-2007. I'm only showing you the last three-plus years. For the layman, the vertical scale is the multiplicative factor set to equal 1 when the month is normal. 1.04 says the month on average has prices 4% higher due to the season it is; a 0.92 says the price is 8% below a normal month. As you can see, the high months begin every April, tending to peak in May and then coast to the fall, where they fall to a nadir in December and January. Naturally, that's when I put money in the fuel bank. Most of my friends know this by observation; I of course have to use an econometric package to get the same answer, proving I'm not smart, just methodical.
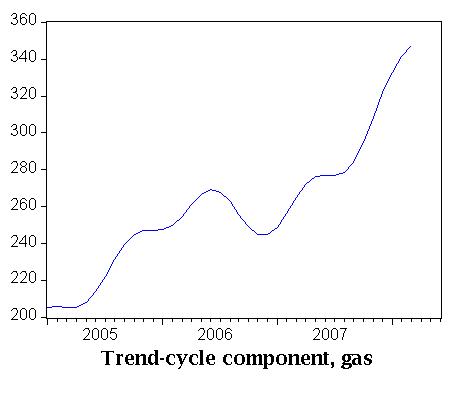
That same analysis also generates an underlying pattern of the trend and cyclical movements of the gas price. Now this picture should scare you if you're worried about gas prices, but it also puts the emphasis back into mid-2007, where I think it really belongs.
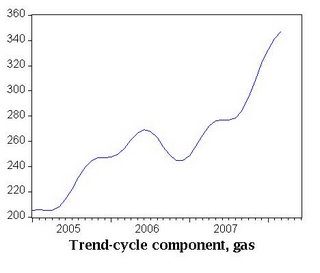 The vertical axis is cents per gallon. This process takes the noise out of series and the seasonality to look for shorter trends, and no doubt the trend is straight up lately. If you extrapolate that trend, even with the decreasing seasonality, a $4 gas price is just slightly less than a 50-50 proposition. I get $3.976 for a July forecast using this very crude estimate. The drop in late fall and winter will only have the price slide back to about $3.65 by December. Why that upsurge is happening isn't really so clear, though Jim Hamilton's contention that it's Fed policy feels pretty right to me. Not that I'm a gold bug, but the price of gold on a monthly chart has about the same pattern.
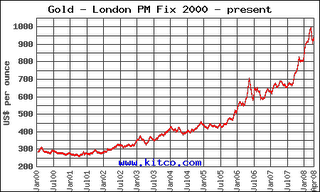 I think that if you took the prices of all commodities -- which may or may not be simply a representation of a weak dollar -- and combined it with the gas seasonal factor, you go a long way to explaining the price of gas. And if you do believe this, you should take Mrs. S's advice. You're not likely to see a price at this level again until December at the earliest. And maybe not even then.
Humor aside, it's worth wondering what is going on right now. We know that records should be corrected for inflation and for changes in taxes, but that won't explain everything. The recent state tax increase should have added only $0.02 so far, and Federal taxes haven't changed. The tax proposals of some (including John McCain) to have a Federal tax holiday doesn't help that much, as Menzie Chinn points out. Half of that shifts back towards oil companies. I'm not looking to tax windfall profits, but there's little sense boosting their profits further at this time. And Chinn notes "to the extent the lower price spurs gasoline consumption, this should increase the petroleum and petroleum products component of U.S. imports, and thence putting further upward pressure on the price of oil..."
Another issue is that these reports come out every spring. Last year we were talking about gas boycotts around this time. Two years ago it was ethanol, another pitch of the tax holiday etc. Three years ago it was evidence of stagflation. Like first pitch, it happens every spring. Here's a chart to show what I mean:
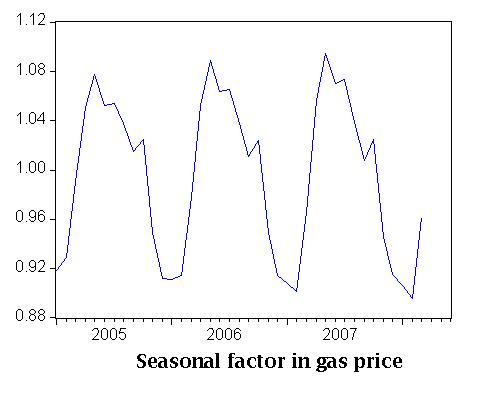 The technical term for this graph is that it is the Census X-12 seasonal factor for the price of a gallon of regular unleaded gas (all formulations, source.) If it matters to you, I estimated it with EViews 5.0 and estimated it over 1980-2007. I'm only showing you the last three-plus years. For the layman, the vertical scale is the multiplicative factor set to equal 1 when the month is normal. 1.04 says the month on average has prices 4% higher due to the season it is; a 0.92 says the price is 8% below a normal month. As you can see, the high months begin every April, tending to peak in May and then coast to the fall, where they fall to a nadir in December and January. Naturally, that's when I put money in the fuel bank. Most of my friends know this by observation; I of course have to use an econometric package to get the same answer, proving I'm not smart, just methodical.
That same analysis also generates an underlying pattern of the trend and cyclical movements of the gas price. Now this picture should scare you if you're worried about gas prices, but it also puts the emphasis back into mid-2007, where I think it really belongs.
 The vertical axis is cents per gallon. This process takes the noise out of series and the seasonality to look for shorter trends, and no doubt the trend is straight up lately. If you extrapolate that trend, even with the decreasing seasonality, a $4 gas price is just slightly less than a 50-50 proposition. I get $3.976 for a July forecast using this very crude estimate. The drop in late fall and winter will only have the price slide back to about $3.65 by December. Why that upsurge is happening isn't really so clear, though Jim Hamilton's contention that it's Fed policy feels pretty right to me. Not that I'm a gold bug, but the price of gold on a monthly chart has about the same pattern.
 I think that if you took the prices of all commodities -- which may or may not be simply a representation of a weak dollar -- and combined it with the gas seasonal factor, you go a long way to explaining the price of gas. And if you do believe this, you should take Mrs. S's advice. You're not likely to see a price at this level again until December at the earliest. And maybe not even then.


