Thursday, October 23, 2008
Credit and intermediation
Banks play a role of channeling funds from depositors to lenders. That role has no doubt shrunk over the last half-century, as other financial intermediaries have grown up. But one thing we graph when we talk about intermediation is the money multiplier -- the ability of banks to use the central bank's liabilities (its monetary base) and convert it to money. It's something we teach that we think is important in understanding fractional reserve banking.
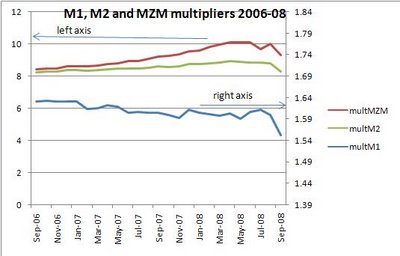
We're being told now, by some pretty smart people, that the idea of a credit crisis has been oversold, and as a result we have had "unprecedented expansion of executive power ramrodded on the back of fear mongering and chicken-little crisis declaration." The paper quoted draws some graphs. Let me add three to the pile that they didn't draw. They relate to the money creation process. First, here's a monthly graph of the three money multipliers (for M1, MZM, and M2.) All these do, for the uninitiated, is take the ratio of the money supply to the monetary base. A higher number means banks are more active in the creation of loans.
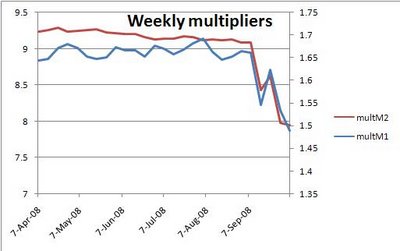
 See that dive in September? Within the data we can see that demand deposits -- business checking accounts -- swelled in late September and have only partially backed down. Firms seem to be hoarding cash right now. Here's that same graph in weekly form (data from the Fed in DC, which does not compute MZM on a weekly basis.)
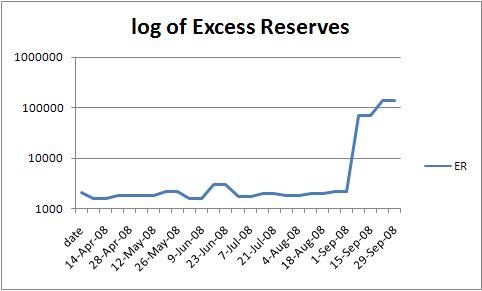
The dive begins around the time that the TED spread begins to widen reaching what Krugman called a fever on Sept. 29. Banks stopped lending to each other, and began instead to hoard:
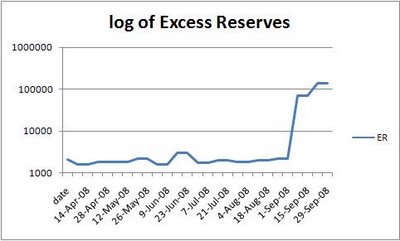
Regarding many of these papers, and to counter some claims that macro can't tell you nuthin', consider this: Any financial crisis involves a rush to liquidity, an increase in the demand for money. The data that gets reported out in central bank publications is not an indication of demand but the intersection of demand and supply. It does not tell me anything if all you show me is the quantity of credit. I also need to know the price. When the yield of a 30-day Treasury is less than 0.25% while the yields on all the other sources of funds increases, there's a fair chance that the increase in demand outstripped whatever additional credit resources the Fed supplied. Excess reserves would be an indication of that. So shift that LM curve to the left and tell me what you see. Real rates up, GDP down.
Likewise with graphs of commercial bank credit -- you can show me an increase in quantity, and I can show you an increase in price. How do you reconcile this, if not that nonfinancial firms were compelled into the bank credit market because other, newer sources of credit had stopped providing funds?
Disintermediation -- the process of borrowers and lenders doing business without financial intermediaries they had previously used -- is not necessarily harmful when the other credit markets are functioning, as they did in the 1980s as innovation decreased the monopoly power of banks. But we had banks in essence in disintermediation when they were the alternative to which many firms had turned. Credit volumes may rise, but without modeling the shift in the demand we do not know if they rose enough.
We're being told now, by some pretty smart people, that the idea of a credit crisis has been oversold, and as a result we have had "unprecedented expansion of executive power ramrodded on the back of fear mongering and chicken-little crisis declaration." The paper quoted draws some graphs. Let me add three to the pile that they didn't draw. They relate to the money creation process. First, here's a monthly graph of the three money multipliers (for M1, MZM, and M2.) All these do, for the uninitiated, is take the ratio of the money supply to the monetary base. A higher number means banks are more active in the creation of loans.
 See that dive in September? Within the data we can see that demand deposits -- business checking accounts -- swelled in late September and have only partially backed down. Firms seem to be hoarding cash right now. Here's that same graph in weekly form (data from the Fed in DC, which does not compute MZM on a weekly basis.)
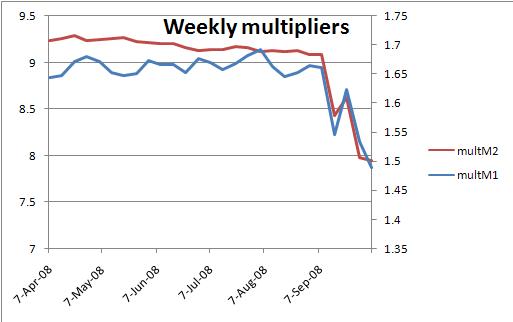
The dive begins around the time that the TED spread begins to widen reaching what Krugman called a fever on Sept. 29. Banks stopped lending to each other, and began instead to hoard:
Regarding many of these papers, and to counter some claims that macro can't tell you nuthin', consider this: Any financial crisis involves a rush to liquidity, an increase in the demand for money. The data that gets reported out in central bank publications is not an indication of demand but the intersection of demand and supply. It does not tell me anything if all you show me is the quantity of credit. I also need to know the price. When the yield of a 30-day Treasury is less than 0.25% while the yields on all the other sources of funds increases, there's a fair chance that the increase in demand outstripped whatever additional credit resources the Fed supplied. Excess reserves would be an indication of that. So shift that LM curve to the left and tell me what you see. Real rates up, GDP down.
Likewise with graphs of commercial bank credit -- you can show me an increase in quantity, and I can show you an increase in price. How do you reconcile this, if not that nonfinancial firms were compelled into the bank credit market because other, newer sources of credit had stopped providing funds?
Disintermediation -- the process of borrowers and lenders doing business without financial intermediaries they had previously used -- is not necessarily harmful when the other credit markets are functioning, as they did in the 1980s as innovation decreased the monopoly power of banks. But we had banks in essence in disintermediation when they were the alternative to which many firms had turned. Credit volumes may rise, but without modeling the shift in the demand we do not know if they rose enough.
UPDATE: Much more good analysis by Mark Thoma and links infra.
UPDATE 2: �Of course we should recognize that paying interest on excess reserves is going to lead them to increase. �I was looking at the Fed's balance sheet, and if you trim it down into this nice form Jim Hamilton created you can see that it's the borrowing from the Treasury that is causing base money to accelerate so much. �I'll update his data:
| Aug 8, 2007 | Sep 3, 2008 | Oct 1, 2008 | Oct 22, 2008 | |
| Securities | 790,820 | 479,726 | 491,121 | 490,633 |
| Repos | 18,750 | 109,000 | 83,000 | 80,000 |
| Loans | 255 | 198,376 | 587,969 | 418,580 |
| � � Discount window | � � 255 | � � 19,089 | � � 49,566 | � � 105,773 |
| � � TAF | � � 150,000 | � � 149,000 | � � 263,092 | |
| � � PDCF | � � 146,565 | � � 111,255 | ||
| � � AMLF | � � 152,108 | � � 114,219 | ||
| � � Other credit | � � 61,283 | � � 87,332 | ||
| � � Maiden Lane | � � 29,287 | � � 29,447 | � � 29,137 | |
| Other F.R. assets | 41,957 | 100,524 | 320,499 | 522,906 |
| Miscellaneous | 51,210 | 51,681 | 50,539 | 52,014 |
| Factors supplying reserve funds | 902,992 | 939,307 | 1,533,128 | 1,855,315 |
| � | ||||
| Currency in circulation | 814,626 | 836,836 | 841,003 | 854,517 |
| Reverse repos | 30,131 | 41,756 | 93,063 | 98,110 |
| Treasury supplement | 388,850 | 524,771 | ||
| Other | 51,440 | 56,884 | 38,717 | 46,213 |
| Reserve balances | 6,794 | 3,831 | 171,495 | 301,270 |
| Factors absorbing reserve funds | 902,992 | 939,307 | 1,533,128 | 1,855,315 |


